Free Starter PicksFree One vs All for Corn One Vs One pairs: Here are examples of economically related markets. |
HO and CL - Manufacturing Chain Correlation - View Free One vs. One Here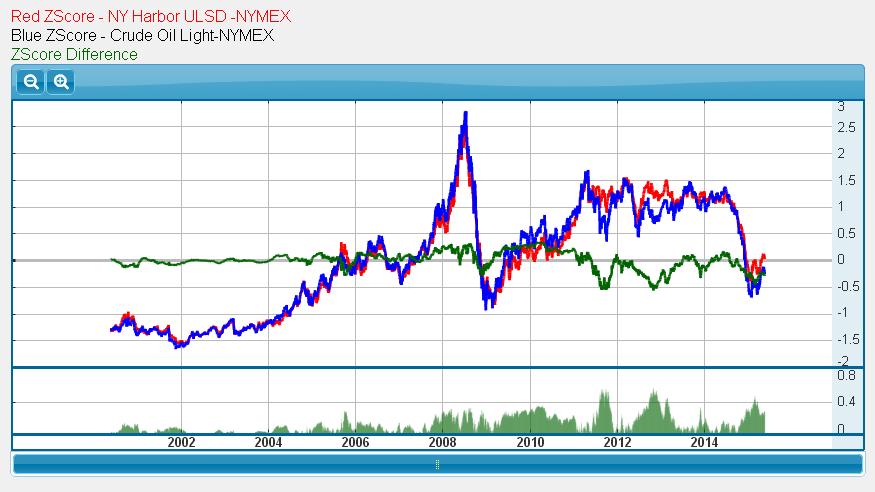 According to an analysis by the Department of Energy, the cost of Heating Oil divides into 42% for the raw Crude Oil, 12% for the refining, and 46% for the distribution/marketing. Since the refining and distribution businesses are quite competitive and efficient, their contribution to the volatility in Heating Oil is generally quite small when compared with the huge volatility in the Crude Oil market generated by geo-politics. There are a few features of the chart which are interesting. The large spike in the green line late in 2005 coincides with the impact of Hurricane Katrina which impacted the offshore drilling in the Gulf of Mexico and the oil refineries. There are at least three reasons why it did affect the hedge so greatly. The refining relationships compounded the uncertainty of the price. Heating Oil merchants had to worry both that the raw material would cost the refiners more and that the lower production capacity of the refineries might create shortages. Whether the refineries would bring older obsolete equipment back online or whether foreign refineries with higher production costs would have to be used was not known. In this case, the uncertainties were also disproportionate. The affected refineries represent a larger percentage of the refinery capacity than the offshore drilling represents as a percentage oil production. The expected downtime for the refineries was expected to be more than for the drilling rigs. A refinery is a complex chemical processing plant involving many interconnected custom/low-production-volume parts. The drilling industry was strong enough that there were plenty of replacement equipment production capacity. The resulting expected decline in inventories was thus expected to be much higher for Heating Oil than for Crude Oil. Another interesting feature in the chart is seasonality. 
This seasonal pattern is rarely
interrupted, and reflects, perhaps, the carrying costs for the
consumer.
At the end of the winter, the customer could buy their oil much
cheaper, but they would have to pay earlier
and bares the risks of having the oil leak.
Since the costs of capital for a leveraged futures position are so
small, there is the potential to profit
from both sides of this cycle.
One could buy the HO future and sell the CL future in the spring, and
sell the HO future short and buy the CL future
long in the early part of winter.
One need merely follow the green signal line. Using the Channel Breakout system provided within Unfair Advantage, this spread backtests to return a 24.1% average annual profit on minimum account equity with a Sharpe ratio of 0.75. For those with Unfair Advantage, see information about how one can trade this spread. |
RS and BO - Substitute Product Correlation - View Free One vs. One HereRapeseed and Soybeans are used to obtained cooking oils by crushing. Although Rapeseed oil is marketed as Canola oil, which is marketed as a superior product. The consumer is still free to switch between them. If one or the other were to get more expensive, then consumers would switch to the cheaper oil. This we depress the higher price and raise the lower price. This makes them substitute products which explains the 81% correlation over 30 years. 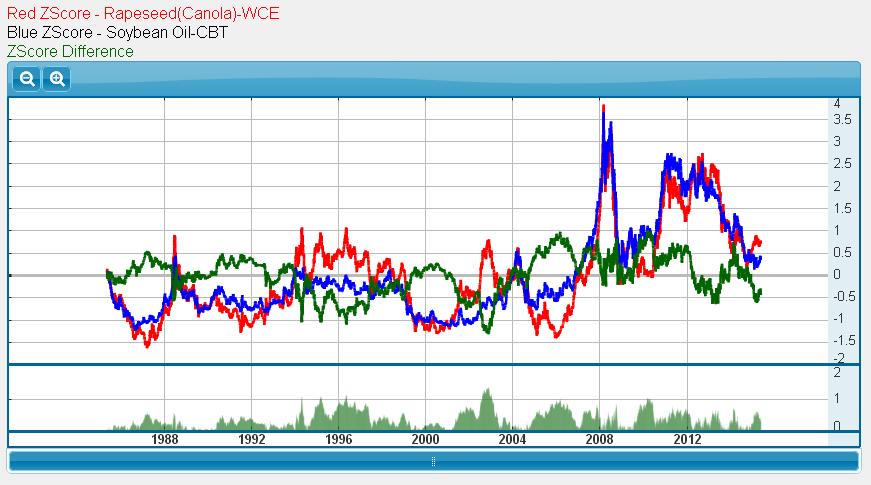
Using the Channel Breakout system provided within
Unfair Advantage, we can backtest this spread using a Z-score significance of 1.0 over 35 years.
Historically, 60% of the traders were profitable. It has a profit factor of 10.39,
an average annual profit on
minimum account equity of 10.0% with a Sharpe ratio of 0.16.
|