What is correlation?
Correlation is a measure of the statistical relationship between two comparable time series. For investors, these series may be two commodities, two stocks, a stock and an index or even a stock and a commodity. The relationship, which can be causal, complementary, parallel or reciprocal, is stated as the correlation coefficient and always reflects the simultaneous change in value of the pairs of numerical values over time.
View the correlation coefficient, which lies between the range of -1.00 to +1.00, as a positive or negative probability that the members of a market pair relate to each other. A negative reading suggests that one member of the pair consistently moves up while the other moves down. Conversely a positive reading suggests there is a tendency for the pair of markets move together in the same direction. A correlation coefficient very close to 0.00 means the two markets have no correlation, indicating that their statistical relationship is completely random.
Perfect correlation is found only in markets that are truly identical, such as an index that is reported in two different ways. Such situations are unlikely to be present in our reports. However, many markets that are linked by industry, market segment, substitutability and other factors exhibit a high degree of correlation. For example, CBT Soybeans and CBT Corn are highly correlated because they share growing seasons at similar latitudes, climate, a common currency, fuel costs and transportation needs. Their correlation coefficient of +0.7595, at the time this report was written, reflects their shared circumstances which is somewhat less than perfect, but remain very noteable.
What does correlation tell us about the markets?
Markets coexist with all other markets in the world economy, and each market responds in different was to similar stimuli. Correlated markets may respond to the common forces in their environment. CSI’s correlation studies synthesize local and global interconnectedness into a single numerical value for each pair of markets studied. Highly positively correlated markets can be expected to move in similar ways. Negatively correlated markets are likely to move in opposite directions. Knowing which markets are positively or negatively correlated with a given market is very important for gaining an understanding of the future directional movement of the market you propose to trade. Directional market movement can be projected with a high degree of accuracy by studying market correlations. When external conditions to a given market vary over time, market prices may temporarily react. When conditions change through time, opportunities may surface that present trading opportunities. Such opportunities are what the trader should be seeking to capture as the markets return to a steady state.
How does one benefit from occasionally departures from a norm suggested through the correlation coefficient?
In CSI’s correlation studies, a coefficient is calculated for every commodity and every stock with every other world commodity and every other world stock that exists within the CSI database for a 10, 12.5, 15, 20, 25, 30, 35 and 40 year periods of daily inter-market trading activity. The CSI website plows through perhaps 250,000,000 market pairs to derive a comprehensive list that reveals the level of correlation for all market pairs. This huge repository of facts is accessible around 8:00 p.m. following the close of world markets each trading day.
To reach the correlation studies on the CSI website, click the “Correlation Reports” reference at the top of the www.csidata.com web page. Enter your User ID and password that was given to you by CSI. To get a report between two markets, click on “One Vs. One.” Enter the market symbol or the market name for the market pair requested. Finally, click “View” for the time period and market type(s) you wish to view.
Exploring multiple markets can be done by search filtering. To do this, click “1 vs. All.” Scroll down to view tables showing the most highly positively and most negatively correlated markets. The tables are sorted by correlation coefficient so the most correlated is shown at the top of the list. The other methods of search filtering are Multiple vs. itself and All vs. All.
Applications:
Your application of the correlation studies will depend upon what you wish to do with the information provided. If you want to simply gain an understanding of market correlations, start with “One Vs. All” tables showing first the markets that have the highest positive correlation coefficients and then the markets with the highest negative correlation coefficients. You’ll find that the most highly correlated values belong to economic series that include T-Bills and other interest rates. As you scroll down through the table to around the 88% correlation level and below, you’ll find more tradable commodity pairs, such as Wheat and Corn, Coffee and Cocoa, Soybeans and Soybean Oil, etc. Markets with the highest negative correlation coefficients are typically interest rates, currencies and indexes, but you’ll find other tradables like Cocoa and Live Cattle around the -56% level. Remember a value of zero (0) is neutral, not .5.
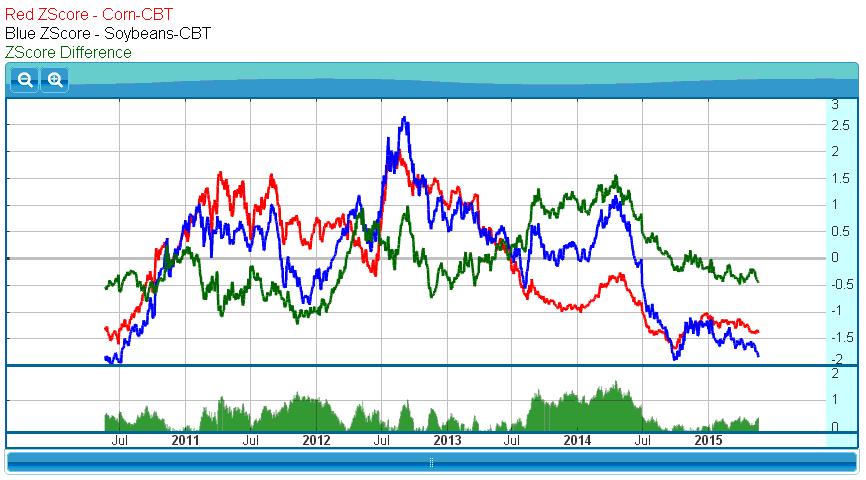
If any of the market pairs on the Correlation Report tables piques your interest, click on it to view a graphic display of the two markets and their relationship, as shown below. You can view the same chart by entering the symbols for any two markets into the selection boxes above the correlation report. Shown below is an example of two highly correlated futures:
Interpretation of the graph:
The above graph was compiled from one year of daily pricing statistics on Soybeans and on Corn. If these had been from non-U.S. markets, their values would have been converted to U.S. dollars. The two series were scaled by subtracting the whole-chart mean and dividing by the whole-chart standard deviation to get their Z-scores, which are shown here. The difference of these Z-scores is also shown. The scale on the right includes both Z-score and the implied normal probability.
The blue line, representing Soybean Z-Scores, is essentially an index of Soybean prices over the last year. The red line of Corn Z-Scores is an index of Corn prices. By using Z-Scores, we can chart both series using a common scale and derive meaningful information from price variations. The green line is the difference (spread) between the Soybean Z-Scores and the Corn Z-Scores, graphically displaying the fluctuations in price between the two. As indicated by both the nearness of the red and blue lines to each other and the recurring proximity of the green line to the center, these markets tend to move together, but do not perform in perfect tandem.
This graph is a visual confirmation of information already made available through the Correlation Report. It corresponds appropriately with and visually confirms this pair’s relatively high correlation coefficient of +0.7595.
Market-Specific Studies
Once you have viewed the main Correlation Reports and any related charts you might choose, you will likely want to learn about other markets that are correlated with the market you are considering trading.
To enter this area of the website, click the “Correlation” button in the left margin again and this time, instead of scrolling down through the tables, enter a stock or commodity symbol into the box labeled “Sorted correlation of a series with everything else.” Select “stock” or “commodity” to properly classify your symbol, and then submit (type a carriage return). A table that includes other market in the CSI database will display, each with its own unique correlation coefficient, identifying its relationship to your chosen market.
Scroll through this list, noticing which markets are most correlated, with coefficients approaching +1, and least correlated (most negatively correlated) with coefficients approaching -1. You can click on any of the market pairs to see Z-Score charts like the one above.
Using Correlation Coefficients to Anticipate Market Direction
Suppose, I’m a Soybean trader and I notice a rise in the price of Wheat. To find out if Soybeans and Wheat are correlated, I enter “S” (for Soybeans) into the box for “Sorted correlation of a series with everything else.” Yes, Wheat is on the list, with a correlation coefficient of +.7275. I can tell by the correlation coefficient and corresponding Z-Score chart that Soybeans and Wheat usually track together.
What if there is no rise in Soybeans to match the observed rise in Wheat? This might indicate a good time to simply wait. If, on the following day, both markets are up and my trading system says to buy Soybeans, I could do so with added confidence, thanks to the knowledge that Wheat is most likely leading the way for Soybeans’ advance. Conversely, if, given the above circumstances except for a signal to short Soybeans, perhaps you should take a pass on trading Soybeans in the opposite direction of a Wheat trend. With correlated markets, one move fundamentally supports to the anticipated directional movement of the other.
Don’t stop with just one correlation comparison. Use the graphic presentations in the correlation studies to verify that the market you propose to trade is moving in tandem with other markets that are heavily correlated over time. If the heavily correlated markets you discover on the website are moving up, your target market will likely move up. On the other hand, if you display a market that is negatively correlated with the market you plan to trade, your chosen market will likely move in the opposite direction.
The most significant analytical value of the correlation studies lies in helping you assure that you are positioned in the market in the correct direction. If your trading signal suggests that you trade against the prevailing direction of correlated markets, you might want to reconsider the trade, or at the very least, be diligent in setting stop-loss orders. With the correlation studies, you will have a good idea whether your holdings are likely to turn a profit or a loss and you can adjust accordingly.